Risk Assessment Form
Every unit across our five-campus system navigates uncertainty while advancing the University’s tripartite mission of teaching, research, and outreach. The ERM group serves as your 'Bureau of How,' helping you take calculated risks to achieve these ambitious goals. The ERM group provides a Risk Assessment Template designed to help project managers and leaders identify high-impact vulnerabilities and strategic opportunities. This tool is designed to be brief and understandable. It streamlines the assessment process, ensuring it remains focused on outcomes. The ERM group is your partner in this process, helping you balance risks across the University's core categories: Financial, Mission & Operations, Safety & Wellbeing, Regulatory & Legal, and Reputational.
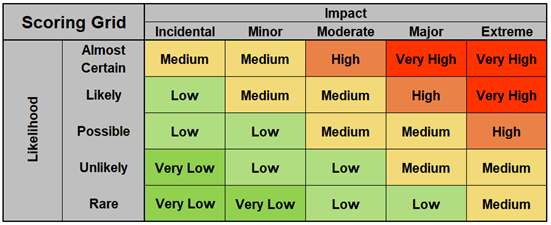
The severity of a risk is measured in terms of its impact and likelihood as visually represented in the example risk heat map below. Breaking risks down into standardized components allows the University to better prioritize and manage risks through the creation of a consistent portfolio view of the many risks facing the University.
The ERM group created the How to Perform a Risk Assessment slide deck with tips and suggestions to use when performing risk assessments.
Determine Risk Scores
Consider using the Risk Assessment Template to assess the impact and likelihood of the risks facing your unit or at the system-wide level. It’s helpful to think about the potential impact and likelihood of risks both before and after any responses we’ve already taken. This helps define the “what could go wrongs”, e.g., if we lost resources or our controls failed, what could happen? The level of risk before your current responses are taken into consideration is referred to as the inherent risk level. That level is reduced by the effectiveness of your risk responses. The resulting level of risk is known as the residual risk level.

Integrated into the University’s risk assessment and mitigation templates, the Risk Heat Map, shown below, translates qualitative data into a visual priority classification. By plotting the likelihood of an event against its potential impact, the grid enables unit leaders to identify which risks require immediate attention. This version is designed to be accessible for departmental use across all five campuses. The more granular Risk Scorecard is reserved for evaluating complex, system-wide strategic risks at the institutional level.
Next Steps
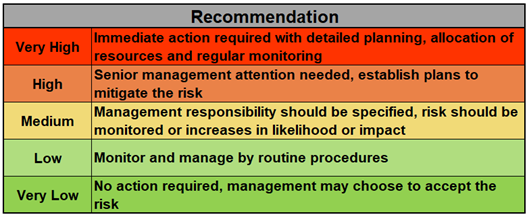
Risk scores can serve as a prioritization mechanism for the wide range of risks facing your unit. The table below is utilized in the risk assessment and mitigation templates. It outlines recommended actions based on the level of residual risk ranging from acceptance of 'Very Low' risks to immediate resource allocation for 'Very High' risks. While these recommendations provide a standard baseline, management may refine the response based on professional expertise, resource availability, and specific institutional priorities.
The result of the risk assessment process is a portfolio of risks and an action agenda. Resources can be allocated for the reduction of prioritized risks followed by less urgent or impactful risks. This will help minimize surprises and the impact of risk on operations and administration. Additionally, when new strategies or initiatives are being considered, the risk portfolio will provide valuable information during the decision-making process.
Risk Mitigation Plan
A Risk Mitigation Plan is a document used to detail both current and planned actions to reduce the impact or likelihood of an identified risk. This planning template has been developed to assist in identifying the various components of a risk mitigation plan and to develop a timeline for finalizing, communicating, and implementing that plan. This planning tool is not a comprehensive list, but rather a guide to help risk owners consider the various aspects of the mitigation plan. The template provided includes generic example information to demonstrate how the form is used.
